Dashboard tour
The dashboard is the first thing you see after signing in. It answers one question fast — what's happening at my property today? This page explains every number on it.
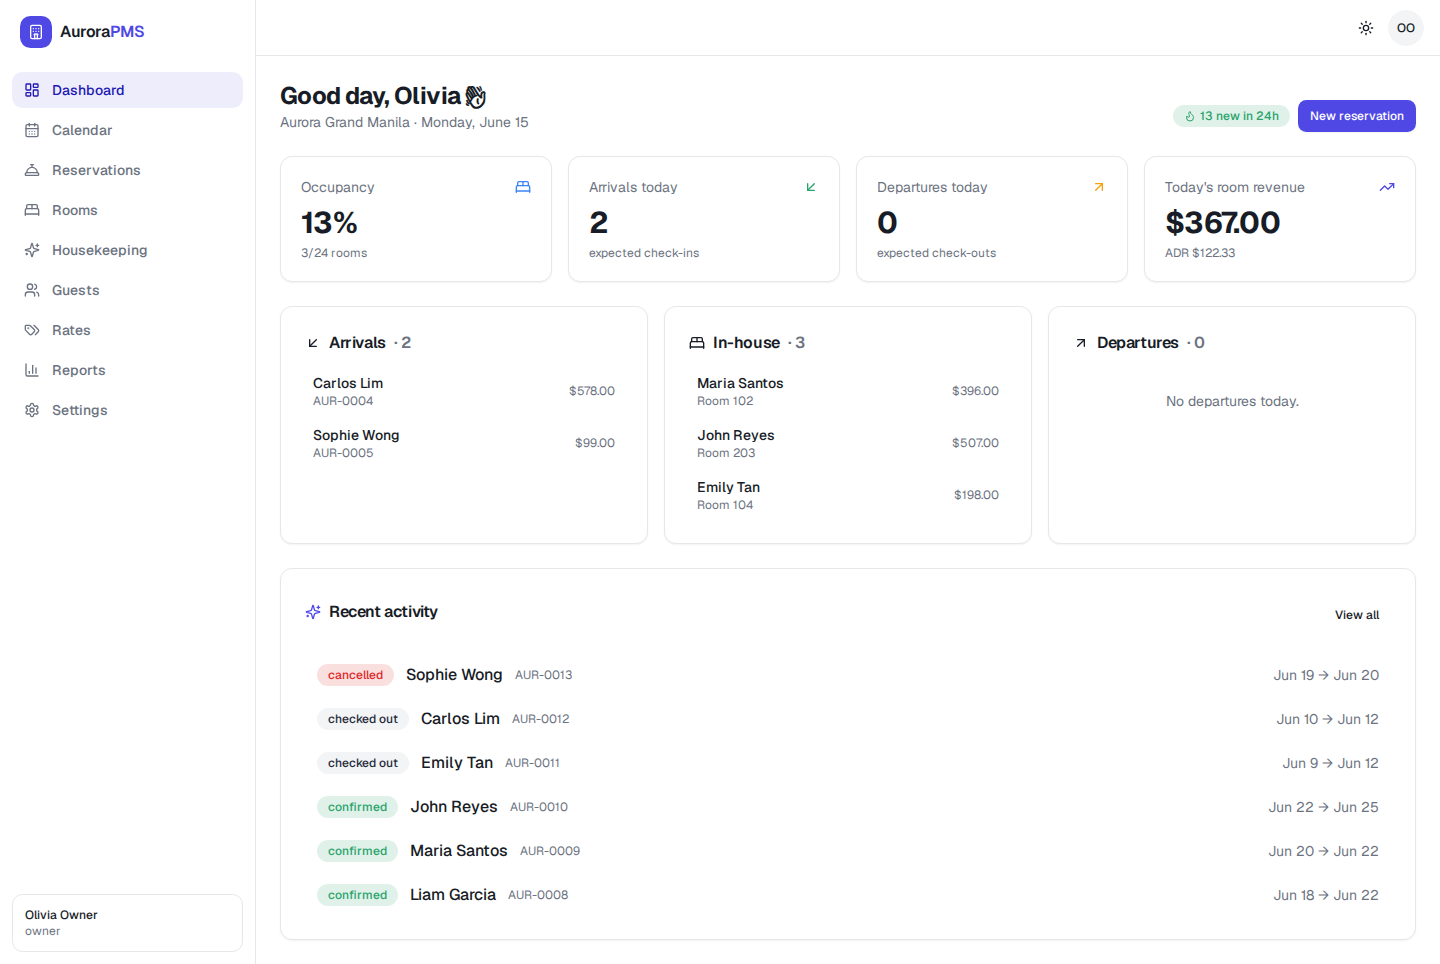
The four KPI cards
The top row gives you the headline numbers for today.
- Occupancy — the share of your rooms that are sold tonight, shown as a percentage with the count beneath it (for example, 13% · 3/24 rooms).
- Arrivals today — how many guests are expected to check in.
- Departures today — how many guests are expected to check out.
- Today's room revenue — revenue booked for tonight, with the average daily rate (ADR) underneath.
Arrivals, in-house and departures
Below the KPIs, three lists give your front desk its to-do list for the day:
- Arrivals — guests due to check in, each with their reference (e.g. AUR-0004) and folio total. Use this as your check-in queue.
- In-house — guests currently staying, with their room number and folio total.
- Departures — guests due to check out today (it reads "No departures today" when there are none).
Recent activity
The feed at the bottom is a running log of what changed — new, confirmed, checked-out and cancelled reservations — each tagged with a coloured status pill, the guest name, the reference and the stay dates. Select View all to open the full Reservations list.
Expected result
In a few seconds you know your occupancy, who's arriving and leaving, who's in-house, today's revenue and what just changed — without opening another screen.
Tip
Use New reservation in the top-right to start a booking without leaving the dashboard. To dig into the day room-by-room, open the Calendar timeline.