Insights
Reports & analytics
See how your property is performing at a glance. The Reports screen shows occupancy, ADR and RevPAR, where your bookings come from, and a 7-day forecast — the numbers you need to price and staff well.
Open your reports
- 1Click Reports. Open Reports from the sidebar to load performance for the next 7 days.
- 2Scan the headline metrics. The cards across the top summarise today and the week ahead.
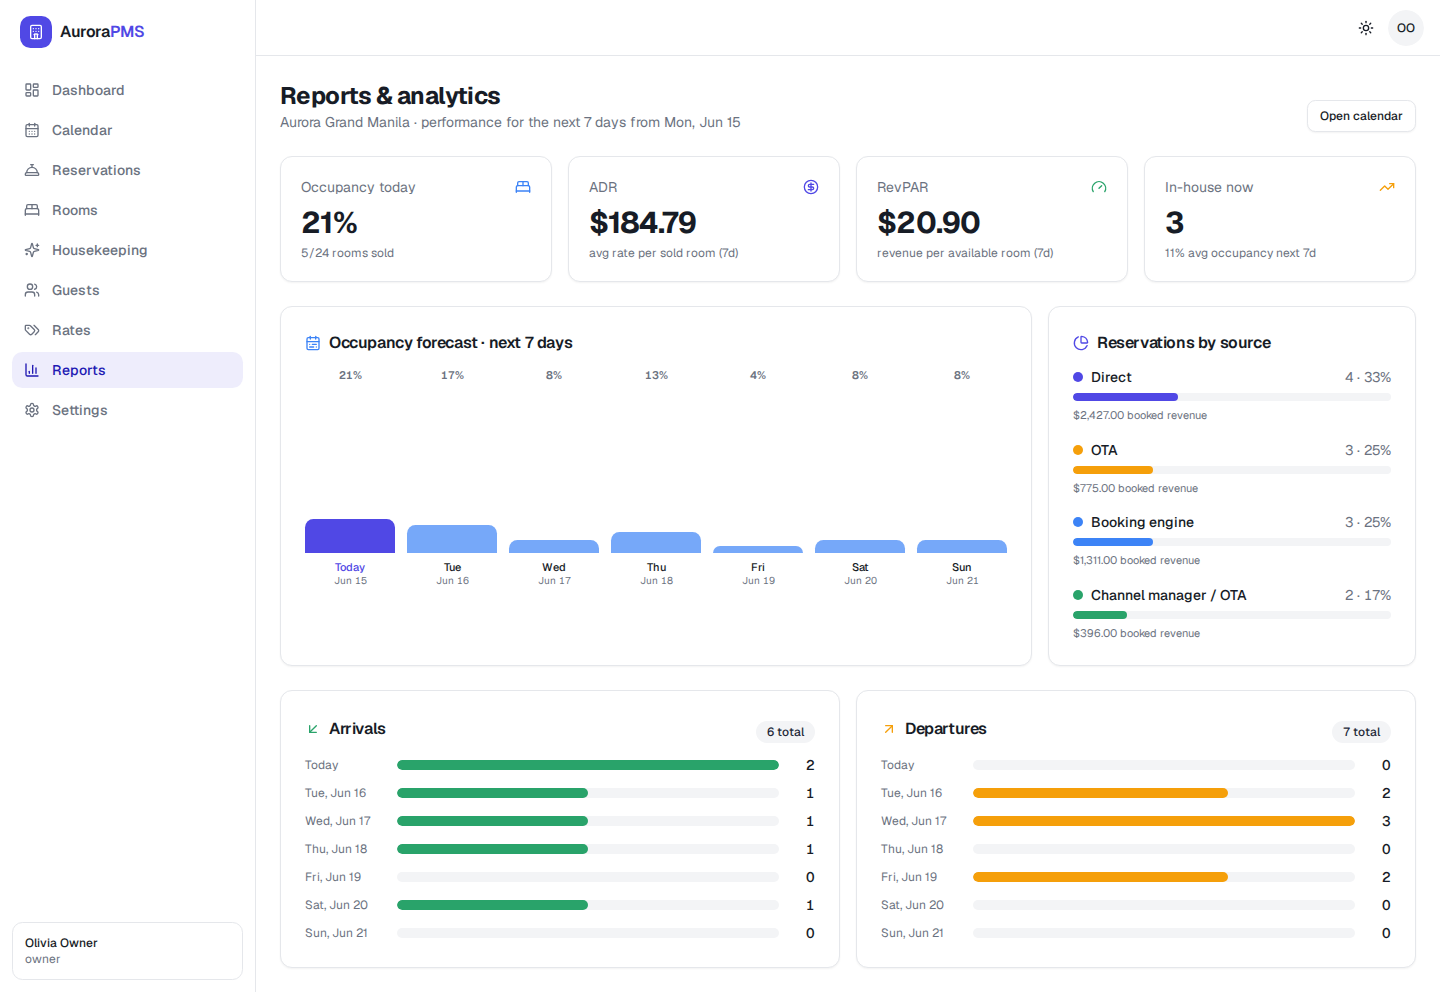
What each metric means
- 🏨 Occupancy — the share of your rooms that are sold (for example 5 of 24 rooms = 21%).
- 💵 ADR — Average Daily Rate, the average price of each room you actually sold.
- 📈 RevPAR — Revenue Per Available Room: revenue spread across every room, sold or not. It blends occupancy and rate into one number.
- 🛏️ In-house now — how many guests are currently staying.
Reservations by source
This panel shows where your bookings come from — Direct, your Booking engine, and your connected channels — with each source’s share of reservations and booked revenue. Use it to see how much your commission-free direct channel is contributing.
The 7-day forecast
The forecast chart projects occupancy for each of the next seven days based on bookings on the books. Use it to spot a soft midweek and drop a rate, or a busy weekend to hold firm — and to plan housekeeping and front-desk cover.
You can read your property's occupancy, ADR and RevPAR at a glance, see which sources drive your bookings, and use the 7-day forecast to make confident pricing and staffing decisions.